The dashboard : ten seconds to know
"Dashboard" page
This is the page that opens when you sign in, and for many people the only one they will ever look at. That is what it is for: to say in ten seconds whether all is well.
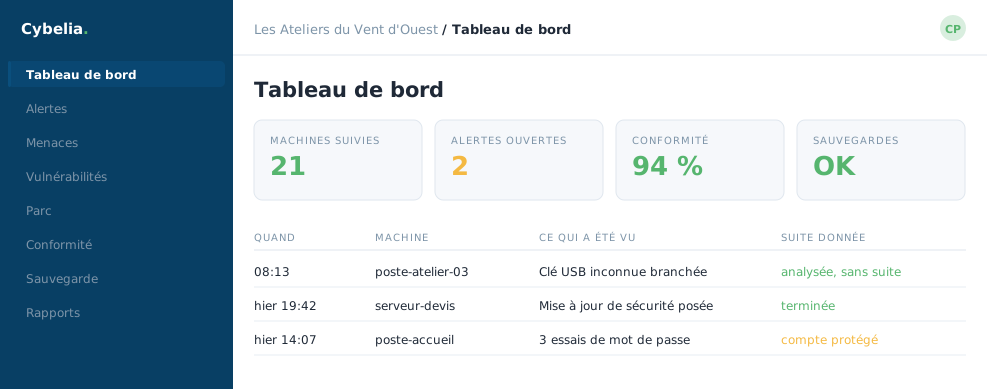 The dashboard of Les Ateliers du Vent d'Ouest: 21
monitored machines, 2 open alerts, 94% compliance, and each of the day's
incidents with the action taken on it.
The dashboard of Les Ateliers du Vent d'Ouest: 21
monitored machines, 2 open alerts, 94% compliance, and each of the day's
incidents with the action taken on it.
The four figures at the top
Monitored machines: how many computers and servers are reporting in. Open alerts: what is left to look at. Compliance: how closely your settings follow good practice. Backups: whether the copies of your data are up to date.
At Les Ateliers, green dominates and the amber simply flags "two things to look at". Neither calls for action within the minute.
The most important column is called "action taken". It says what has already been done about each incident: analysed, no follow-up, completed, account protected. An incident with no action taken is the only case that calls for a move, and it is rare.
The company selector
If your organisation holds several companies, a menu at the top lets you show just one, or all of them. Les Ateliers have three sites but a single company, so the menu stays on "All companies".
An amber banner, occasionally
Sometimes a banner announces that a service is not responding and that some counters are temporarily at zero. That is not a failure of your equipment: it is the portal telling you honestly rather than showing a wrong figure. It retries on its own every thirty seconds.
In closing
This page is made to be closed again. Ten seconds in the morning, and if nothing calls for your attention, your day can start. That is the sign the tool is doing its job, not that nothing is happening.
Commenting is not enabled on this course.