Activity : the running thread of what happens
"Activity report" page
Alerts show what was noticed. Activity shows what simply happens: logins, compliance scans, changed files, machines connecting or disconnecting.
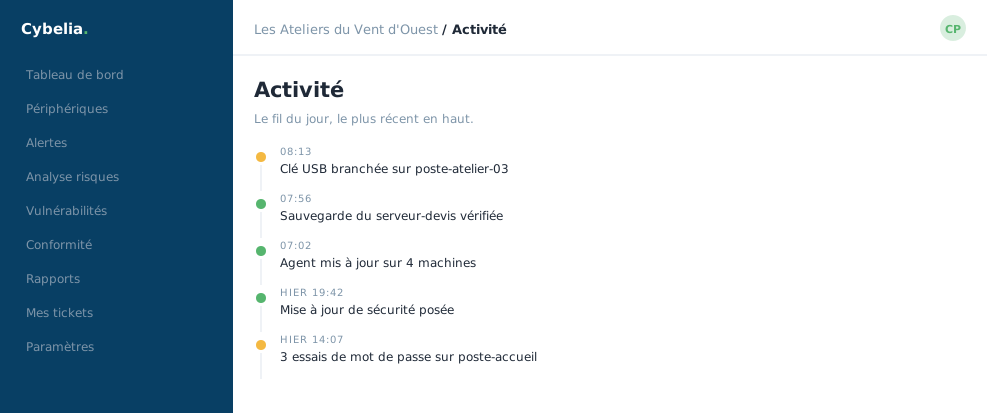 The day's feed, most recent at the top: what happened, hour by hour.
It is the thread of everyday life. Most of the time nothing interesting occurs, and that is exactly what one wants to read.
Four counters and five filters
At the top: the total number of devices, how many are connected, how many are disconnected, and the number of events. Below, buttons to keep only one type: Alerts, Compliance, Files, Connections, or All.
Two further filters sharpen it: a severity threshold (medium and above, high and above, or critical only) and a field to follow one specific machine.
This is the page to open to answer "what happened on Tuesday?". It is not meant to be watched continuously. It is for retracing a specific sequence after the fact, and it does that very well.
The four kinds of event
Alert: something was noticed. Compliance: a settings scan ran. Files: a watched file moved. Connection: a machine connected or disconnected.
Each line links through to the record of the machine concerned, and compliance lines link to the matching good-practice reference. So you move from the event to its explanation without ever losing the thread.
An empty list on a recent workspace is normal: events arrive as soon as machines are connected. The screen says so itself.
In closing
Activity is the daily thread, and it is meant to be dull. You do not open it every day: you come back to it afterwards, to reconstruct a timeline when a question arises.
Commenting is not enabled on this course.