How much electricity does a region produce on its own? What would a data center hosting artificial intelligence workloads weigh? Where should the next megawatts go? To put these questions on the table with elected officials, public staff and residents, Cybelia Cloud has built a demonstration smart grid, open in read-only mode and readable with no technical background at all.
Start from measurement, not intuition
Energy sovereignty starts with a simple question: what do we produce, what do we consume, and what do we bring in from elsewhere? The demonstration is built on public figures: annual electricity and gas totals by sector (Enedis and GRDF), wind turbines and solar panels listed in the national registry, actual weather from the past year, and locations taken from OpenStreetMap. These totals are then broken down by town, by sector, by substation and by sensor, hour by hour.
The result speaks for itself: in the modeled metropolitan area, about 8.6% of the electricity consumed is produced locally. Everything else comes from the national grid.
More than 6,000 sensors, eleven dashboards
Smart benches, bus stops, parking lots, substations, schools, streetlights along the roads: more than 6,000 simulated sensors are placed at real addresses. Eleven dashboards group them by theme: the region's energy, the data center and AI, data for planning ahead, where the electricity comes from, projects, gas heating, buildings, mobility, the connected city, towns and sectors, and mutual support between neighboring regions.
Each tile leads to the equipment the figure comes from: an elected official sees the result, a technician sees how it is built.
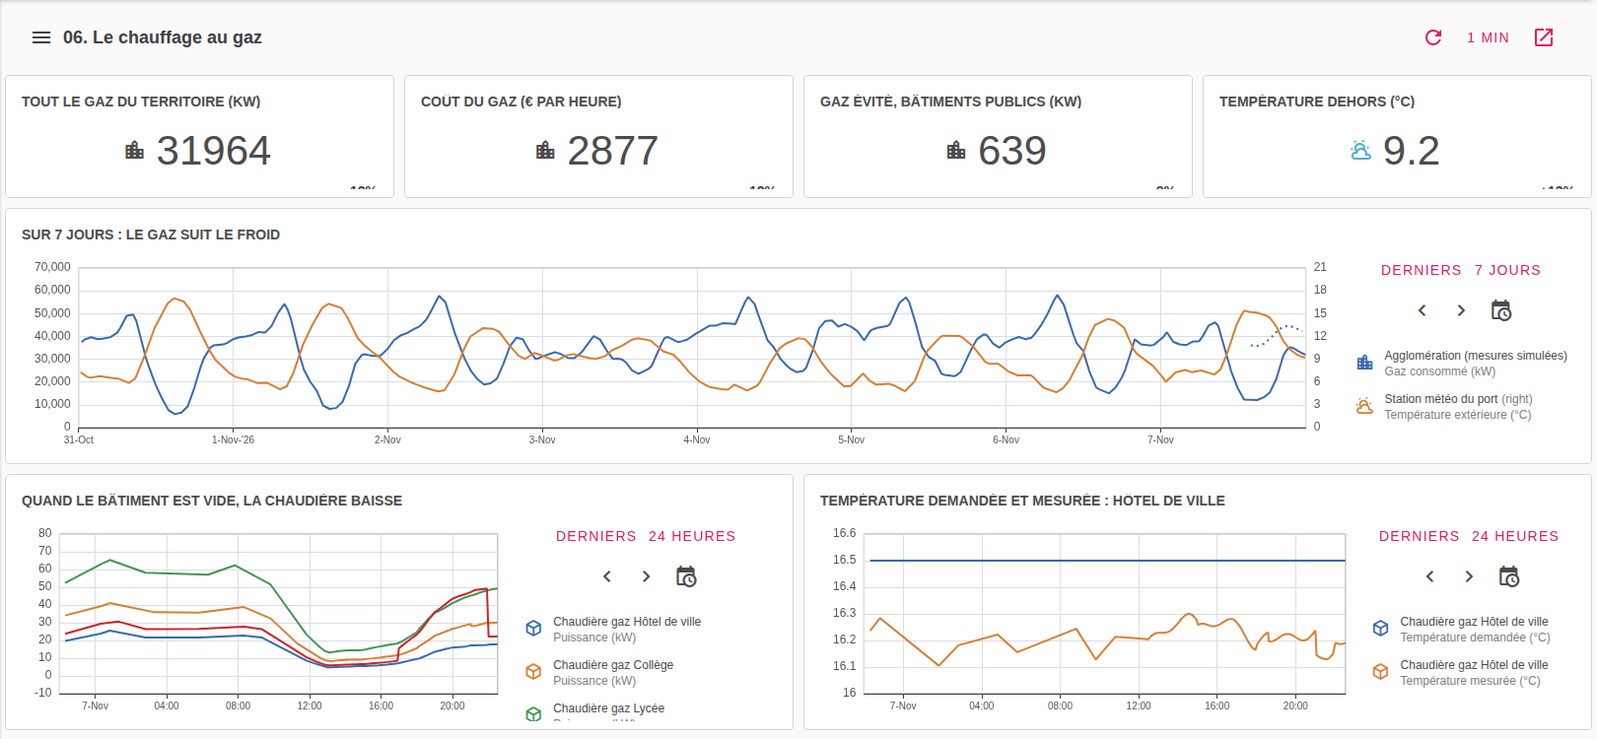
Gas heating: over seven days, consumption rises as the temperature drops.
The data center and AI, figures in hand
The central scenario is deliberately concrete: a regional data center, three-quarters full, would consume around 10 GWh per year, roughly a third of all local production. The demonstration also shows what that heat could become: heating a swimming pool instead of burning gas.
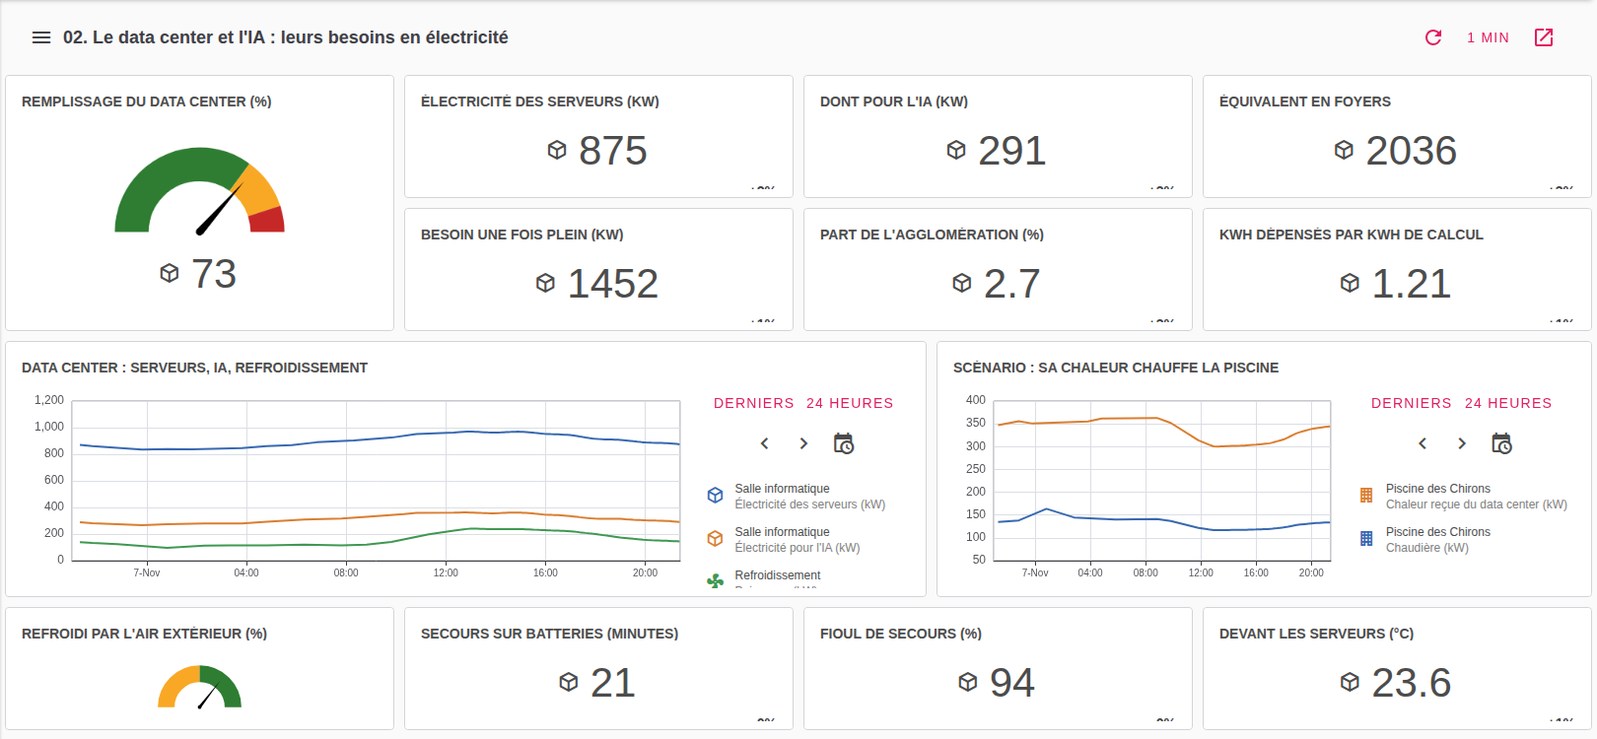
The data center and AI: occupancy, share of AI computing, household equivalent, heat sent to the swimming pool.
A report for every reader
The same figures can be read three ways: for the facility manager, for the mayor and elected officials, and for the State and the prefecture. Each report fits on one page, can be printed, and states what is real, what is simulated and what is part of a scenario.
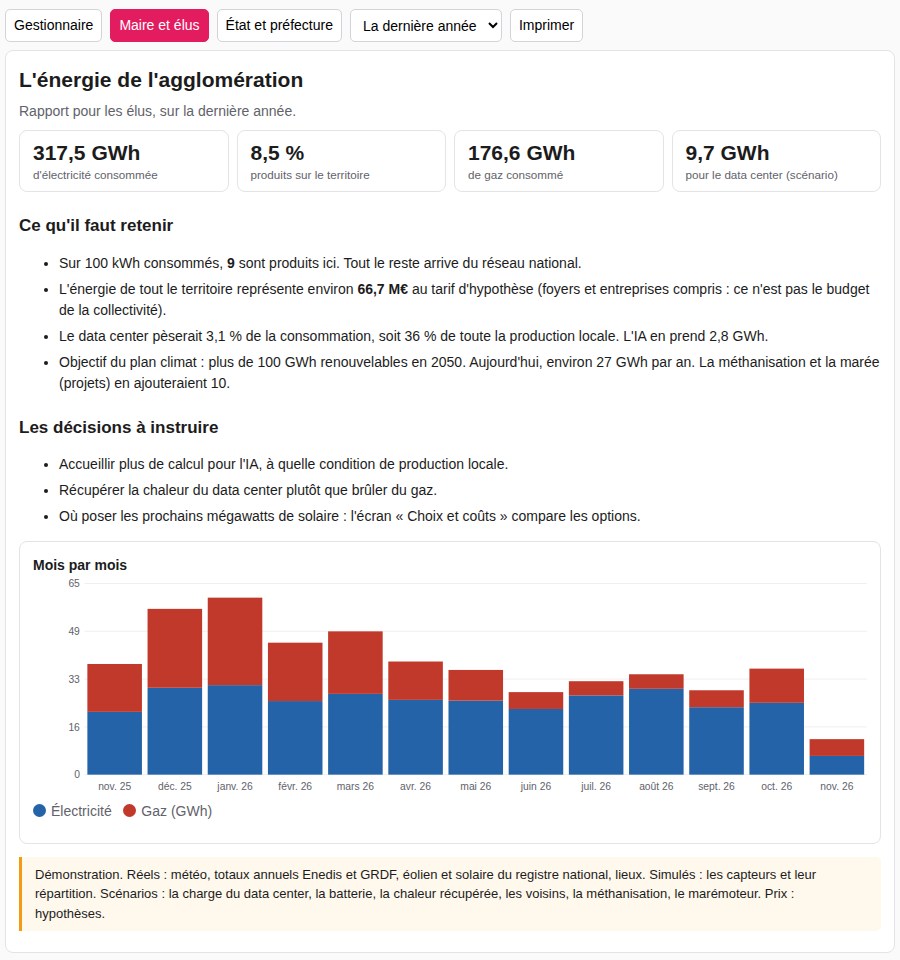
The report for elected officials: the key takeaways, and the decisions to consider.
Choices, with their costs
One degree lower in public buildings, boiler control based on occupancy, heat from the data center, five megawatts of solar, LED street lighting: for each decision, the investment, the annual savings, the payback period and the CO2 avoided. Every assumption can be changed on screen: just enter your own quotes.
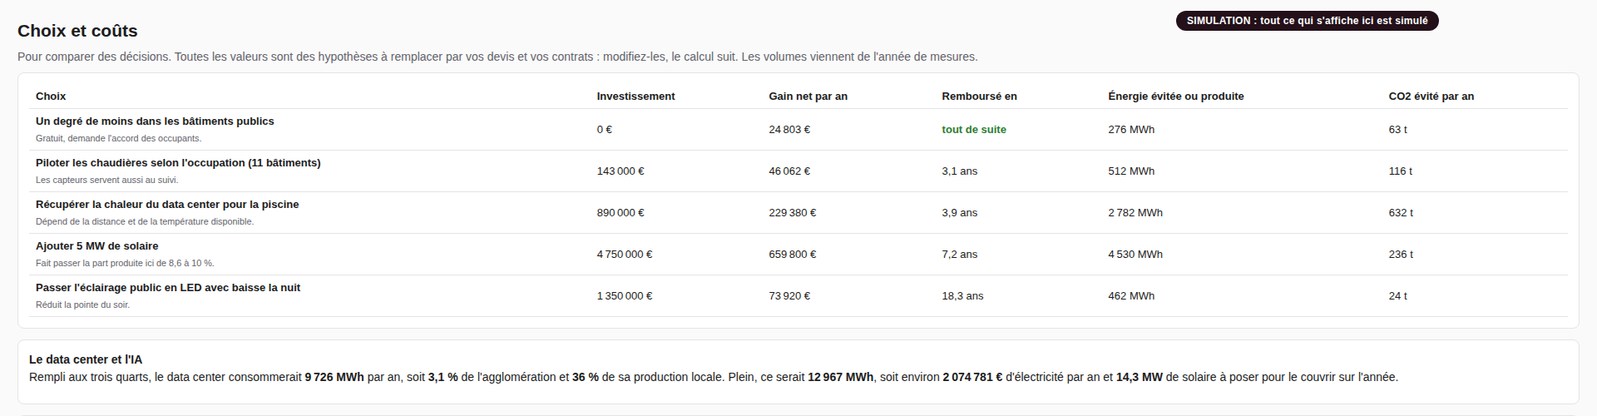
Cybèle answers from the measurements
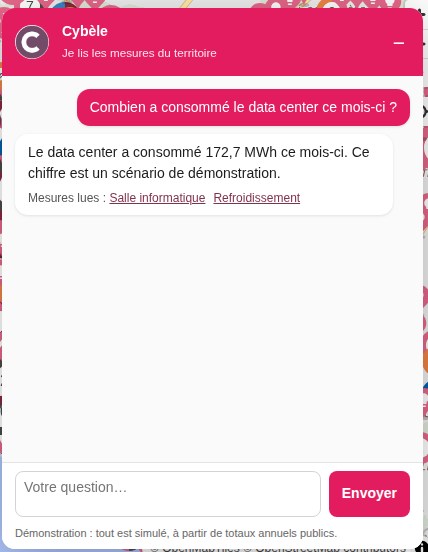
At the bottom of every screen, Cybèle, Cybelia Cloud's AI assistant, answers questions the way a colleague would: “How much did the data center consume this month?”, “Which sensors should be repaired first?”. She reads the measurements, the code does the math, and every answer cites the equipment it read. Her model runs on Cybelia Cloud's infrastructure, in France.
What a demonstration like this really shows
Everything on display is simulated, and every screen says so. The sensors are not installed; the data center, the battery, the tidal power plant and the biogas facility are scenarios. What is real is the method: start from public data, make it readable, and let everyone ask their own questions.
It is also a digital twin of the region: a living copy you can query to understand before you decide. The same principle applies to a company, its machines, its buildings and its know-how.
The demonstration account cannot change anything: the platform rejects all writes, and the shared account's login settings are locked. The demonstration will be presented at a conference on energy sovereignty, data and AI on December 8, 2026.
See it for yourself
Local authorities, building managers, businesses: for a guided tour or access to the demonstration, write to contact@cybelia-cloud.fr.