Use case · Smart grid for a region
Energy sovereignty
starts with measurement.
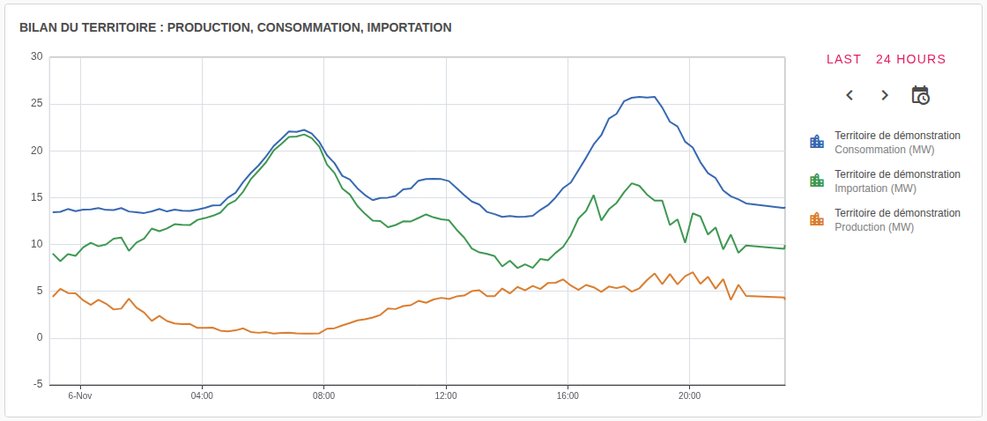
A metropolitan area wants to know what it produces, what it still imports, and what data and AI can change. From the connected bench to the data center, everything comes up on a single dashboard.
The situation
Meters sit with the distributor, buildings with each manager, lighting with a contractor. Nobody can say, at a given time, what share of the region's energy is produced locally. Without that measurement, there is no deciding where to invest or what to shift at peak time.
What gets in the way
- Data scattered across dozens of devices and contractors
- Local production that varies with sun and wind
- An evening peak covered by the national grid
- Invisible resources, such as the waste heat of a data center
How it works
- 1
Measure
Substations, solar, wind, batteries, public buildings, sports halls, street lights, connected benches, charging stations, air and water: each device sends up its readings.
- 2
Bring together
Everything arrives on a single platform hosted in France, whatever the protocol: LoRa and LoRaWAN sensors, PLCs, meters.
- 3
Understand
A regional balance reads at a glance: autonomy, local production, imports, renewable share.
- 4
Forecast
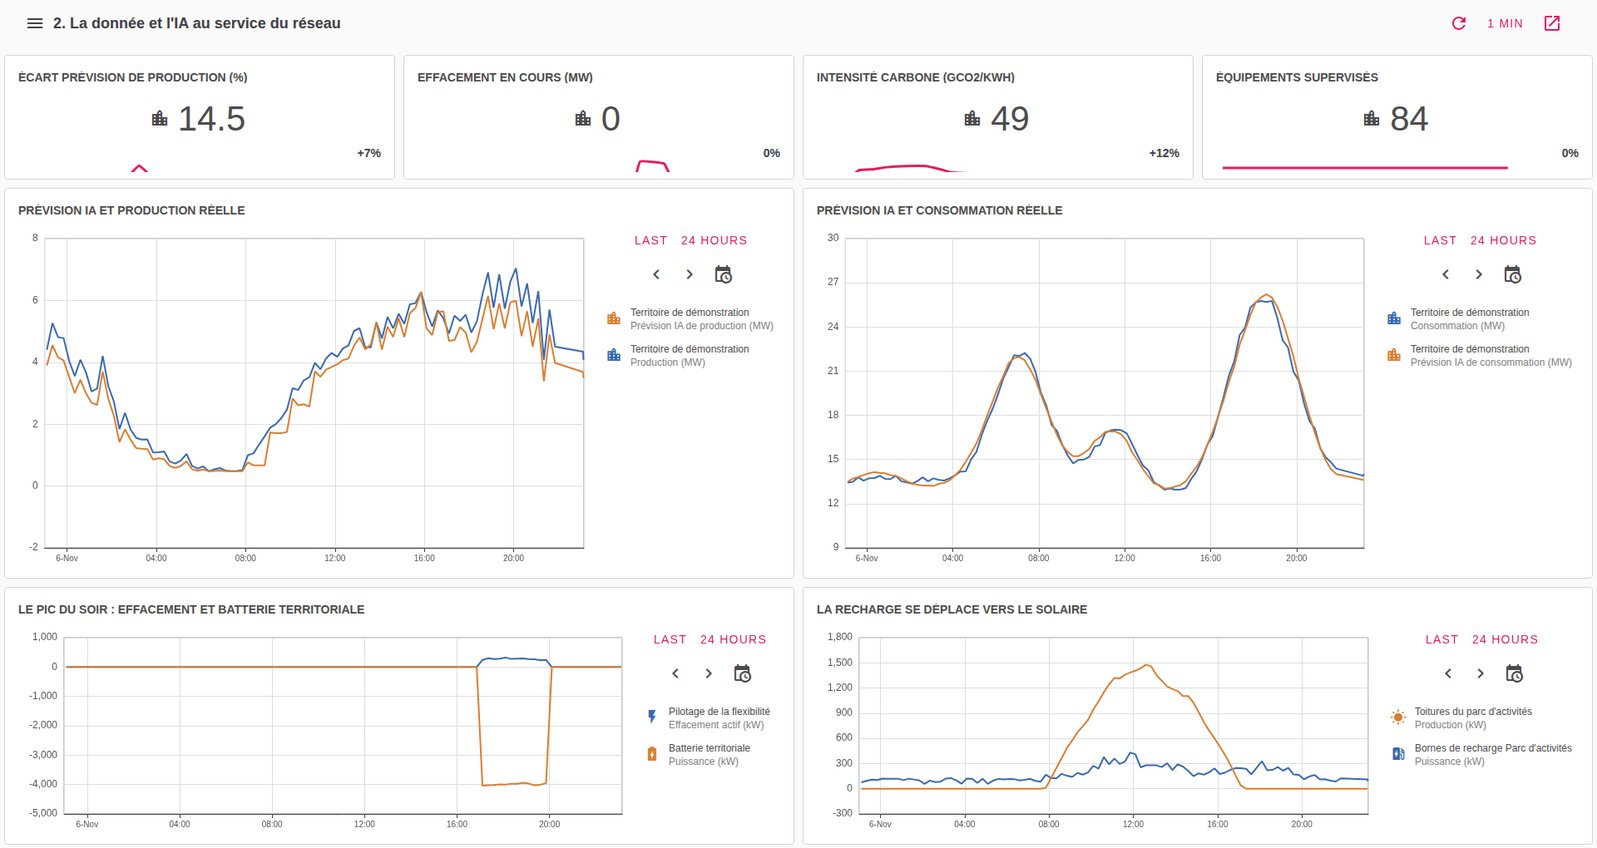
AI compares its production and consumption forecasts with reality, and announces the peak before it comes.
- 5
Act
Batteries, deferred charging and dimmed lighting shed what can wait at peak time.
- 6
Reuse
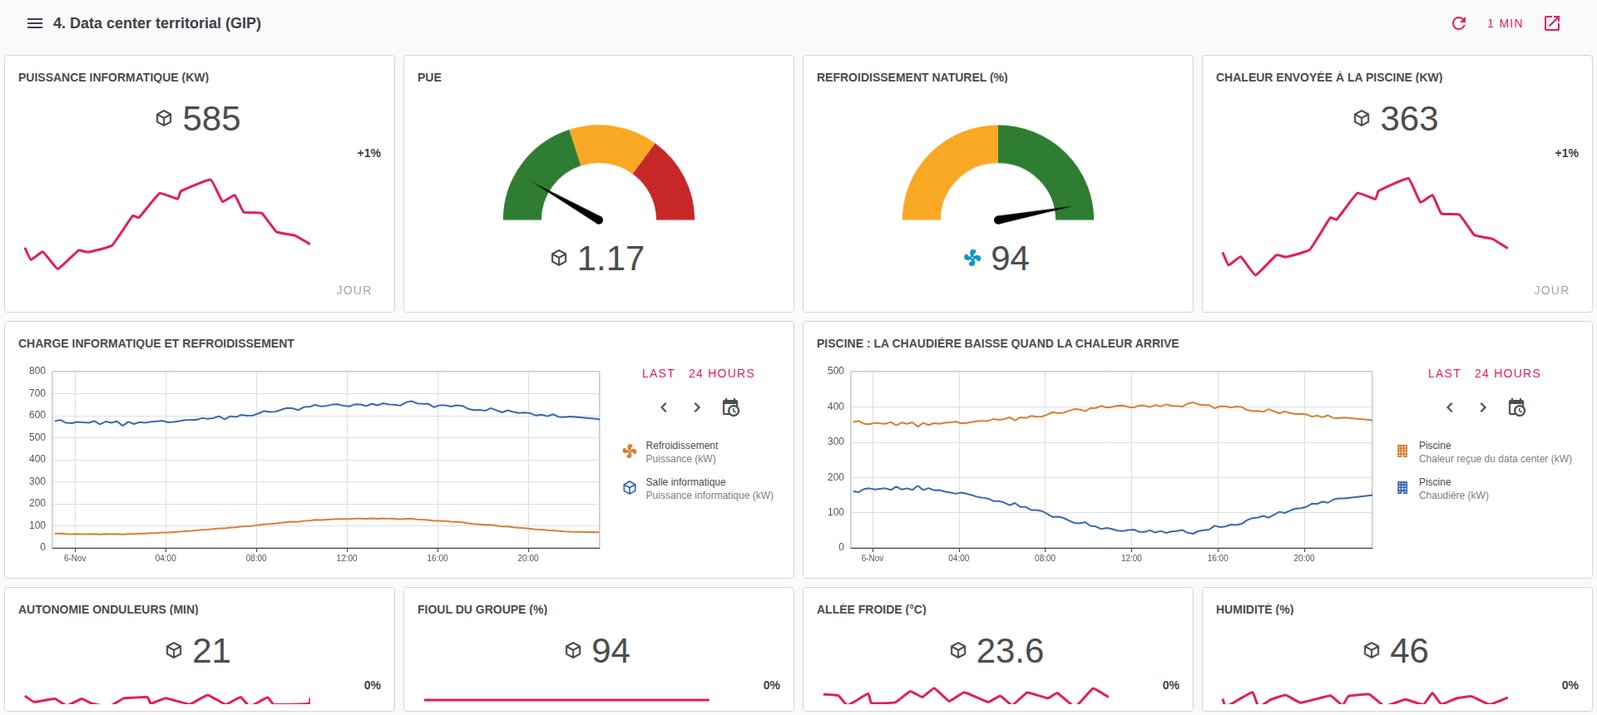
The heat of the regional data center feeds the nearby swimming pool: the boiler drops as it arrives.

What changes
Visible autonomy
The region sees its share of local energy live and over the week, and decides with full knowledge.
Data that stays here
A region's measurements say a lot about it: they stay hosted in France, on a platform under control.
A better-held peak
Storage and load shedding are prepared in advance, from the forecast.
A data center useful twice
Its load, cooling and reused heat are followed on one screen.
Buildings that speak
Consumption, occupancy and air quality of public buildings and sports halls, slot by slot.
A better-known town
Connected benches, bins, car parks, shuttles and the environment join the same dashboard.
Demonstration on our IoT platform. The screens are real, the measurements are simulated: this case does not describe any local authority.
Does your situation look like this?
Tell us how you work: we will look together at what applies to you.